
PDF:
Context: It is hypothesized that a fifth force of nature can be observed as interplanetary forces. Here, we look at potential evidence that Mars acts on Venus according to the expression 


Figure 1 is adapted from figure 7a, Horinouchi et al (2024) [Ref1]. The original figure compares zonal winds from Akatsuki’s 365-nm images (black dots) with data from the Venus Express (VEx) spacecraft (blue dots), specifically from VMC data. These winds are averaged over a local time (LT) range of 11–13 hours and between 24°S and 18°S in latitude, binned into 5-day intervals, and only include bins with valid data for 3 or more days.
Here, I’ve overlaid a plot of U(Mars) (continuous black lines). The period 2006-14 shows westward velocity boosts (pushing with the wind), which coincide with increasing wind speeds in the VEx data. From 2017 onwards, U(Mars) becomes increasingly positive (eastward, pushing against the wind with increasing strength). This coincides with a general decrease in wind speeds as shown in the Akatsuki data.
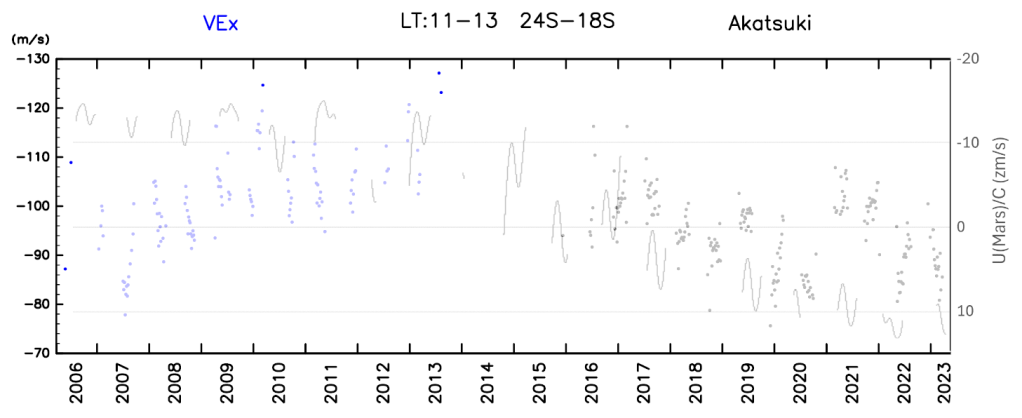
Figure 1
Figure 2 is adapted from figure 13, Peralta et al (2018) [Ref2]. The original figure presents the decadal variation of zonal winds at the nightside lower clouds of Venus, spanning 38 years (1978 to 2017). The figure compares wind speed data obtained via different methods, such as cloud tracking and in situ measurements at altitudes of 50–60 km.
Again, I overlaid a plot of U(Mars) (continuous black lines). The period 1985-94 shows eastward velocity boosts (pushing against the wind), which coincide with a general decrease in wind speeds from 1985 to 1990.
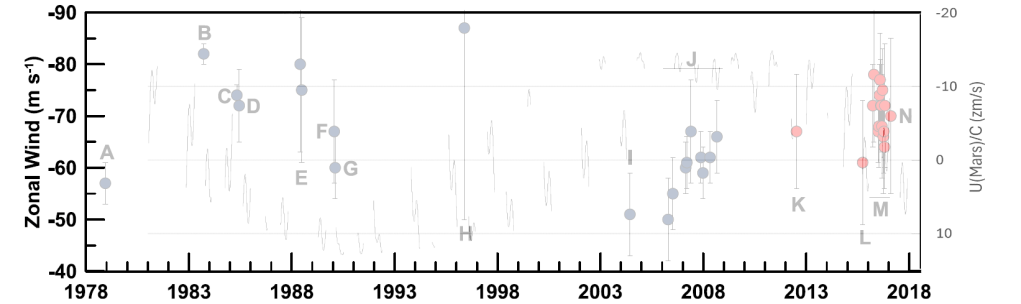
Figure 2
References
1. Horinouchi et al (2024). Long‐Term Variability of Mean Winds and Planetary‐Scale Waves Around Venusian Cloud Top Observed With Akatsuki/UVI. Journal of Geophysical Research, 129(3), e2023JE008221.
2. Peralta et al (2018). Nightside winds at the lower clouds of Venus with Akatsuki/IR2: Longitudinal, local time, and decadal variations from comparison with previous measurements. The Astrophysical Journal Supplement Series, 239(2), 29.

Leave a comment