
PDF:
Context: It is hypothesized that a fifth force of nature can be observed as interplanetary interactions. Here, we look at potential evidence that Mars acts on Earth according to the expression 


To test whether Mars influences Earth’s atmosphere, we utilized a comprehensive dataset covering mean daily U-wind speeds from 1981 to 2023, totalling 15,695 observations [Ref1]. These values were averaged over all latitudes, longitudes, and atmospheric pressure levels.
On any given day, there are four major bodies that could be closer to Mars than Earth. These are: the Sun, Venus, Mercury, and the Moon. We divided wind data into two groups: days when Earth was closer to Mars than the Sun or Venus, and all other days. For convenience, define S as a sphere of radius Earth-Mars distance centred on Mars. The value 

Figure 1 shows the differences in U-wind speeds on days when 


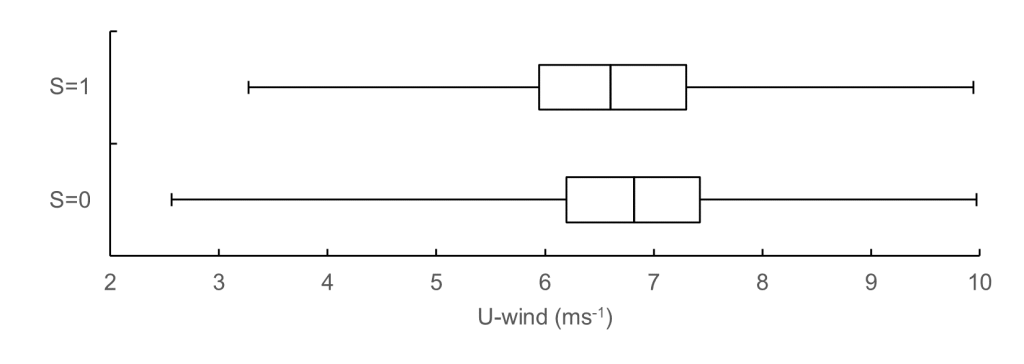
Figure 1. U-wind speeds when S=0,1.
Figure 2 compares U-wind speeds with U(Mars). It shows the relationship between mean daily U-wind speeds and U(Mars) over the period from 1981 to 1 March 2025. In many instances, peaks and troughs in U(Mars) appear to correspond with similar patterns in U-wind speeds, including a noticeable time lag. The panels extending beyond 2024 into 2035 provide projected values of U(Mars), suggesting future trends that could potentially affect U-wind speeds.
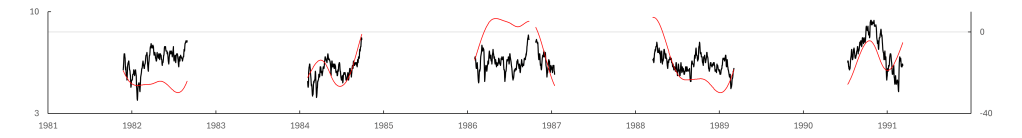
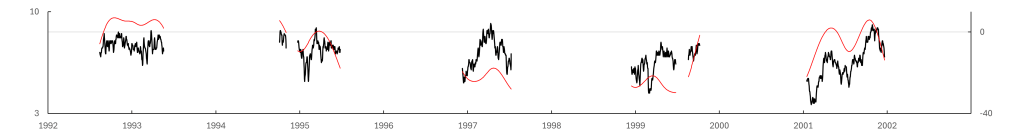
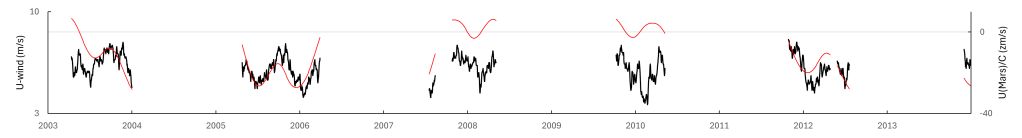
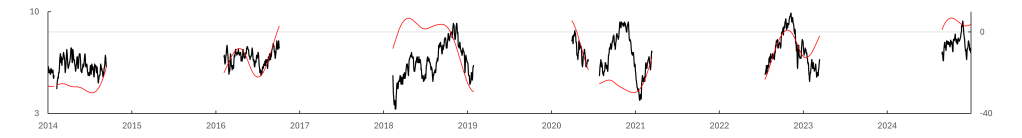
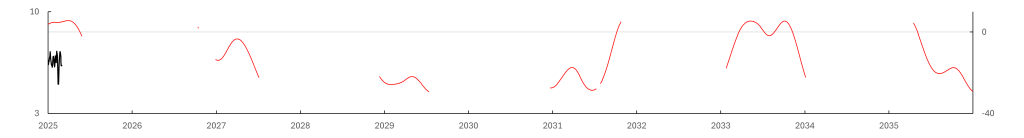
Figure 2. Mean daily U-wind (1981-2025) vs U(Mars) (1981-2035) when S(Mars)=1. Thick lines represent U-wind speeds (1 Jan 1981 – 1 March 2025). Thin lines represent U(Mars). Gaps show periods when S(Mars)=0.
Figure 3 shows a clear long-term daily relationship between U-wind and U(Mars). A regression analysis showed that 


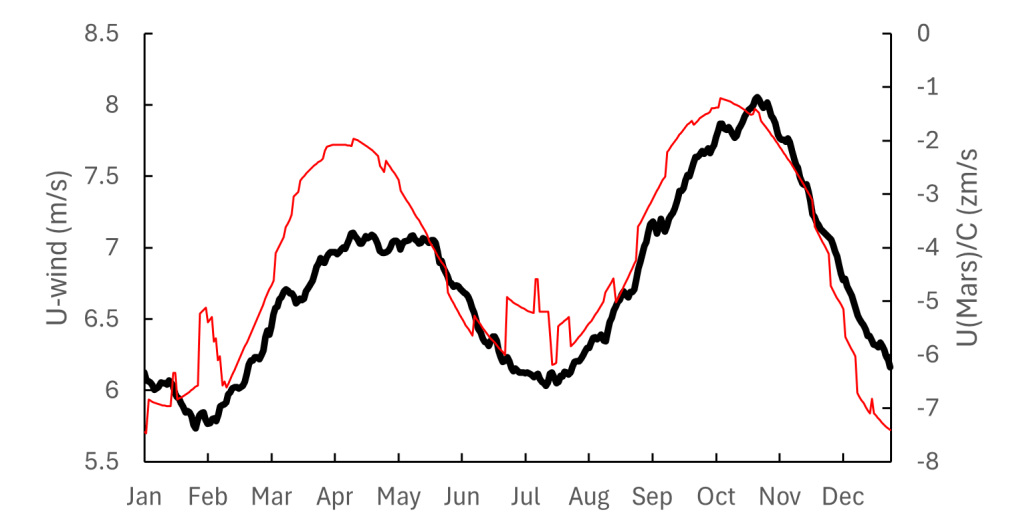
Figure 3. Long-term U-wind vs U(Mars) (1981-2023). The thick line represents U-wind. The thin line represents U(Mars).
The observed correlation between the relative positions of Earth and Mars and Earth’s atmospheric conditions presents an intriguing finding. Our analysis indicates that when Mars-Earth distance is less than Mars-Sun and Mars-Venus distances (S = 1), there is a statistically significant difference in mean daily U-wind speeds compared to other days (S = 0). This finding is supported by the results of the two-sample T-test which showed a p-value of 
Moreover, the relationship between U-wind speeds and the hypothesized U(Mars) suggests a potential dynamic interaction. The regression analysis substantiates this connection, with an 

Despite these compelling findings, it is crucial to approach these results with caution. Several potential confounding factors could influence these observations, including solar activity, the gravitational effects of other planets, and varying atmospheric conditions on Earth. These factors need to be meticulously controlled in future studies to isolate the specific impact of Mars’ relative position on Earth’s atmospheric behavior.
Additionally, the dataset spans over four decades (1981-2023), providing robust temporal coverage. However, more rigorous statistical testing and the incorporation of additional datasets are necessary to validate these findings further. For instance, employing Granger causality tests could help refine our understanding of the causal dynamics between planetary positions and atmospheric conditions.
Future research should aim to extend the analysis by incorporating more comprehensive astronomical data and exploring the influence of other planetary bodies. By isolating and understanding these complex interactions, we can advance our knowledge of how extraterrestrial factors might influence terrestrial weather patterns, thereby enhancing our predictive capabilities for future atmospheric phenomena.
References
1. Kalnay et al (1996). The NCEP/NCAR 40-year reanalysis project. Bull. Amer. Meteor. Soc., 77, 437-470.

Leave a comment