PDF:
Context: It is hypothesized that a fifth force of nature can be observed as interplanetary interactions. Here, we look at potential evidence that Mars acts on Earth according to the expression 


We tested whether our hypothesis has a measurable impact on the Niño Index. To do this, we divided the Niño Index into two periods: when Mars-Earth distance was less than both Mars-Sun and Mars-Venus distances (Mars in range), and when it was not [Ref 1]. We then performed a two-sample t-test for means assuming unequal variances.
We used NOAA’s Ocean Niño Index (ONI) dataset, which provides monthly sea surface temperature (SST) anomalies for the central Pacific Ocean from January 1950 to September 2024, based on a 3-month running mean [Ref 2]. This dataset relies on SST anomalies derived from the Extended Reconstructed Sea Surface Temperature version 5 (ERSSTv5) dataset, specifically for the Niño 3.4 region (

We compared each 3-month average with our monthly variable using the middle month. For instance, the December-January-February (DJF) 1950 value of -1.53 was compared to our binary value of 1 (Mars in range) for January 1950.
We found that the mean Niño Index values were -0.206 when Mars was in range, and 0.129 when Mars was not in range [figure 1]. An initial analysis with a t-test (

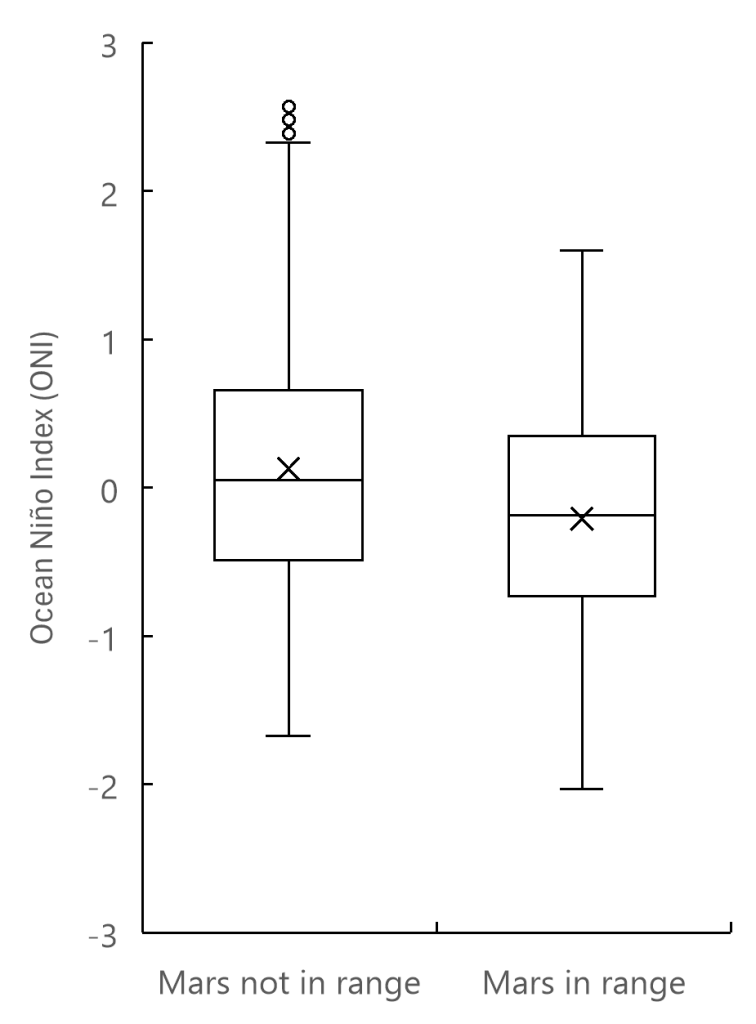
Figure 1. Ocean Niño Index (ONI, 1950-2024) when Mars is in range and when it is not.
References
- Talbot, L (2024). Mars’ Effect on Earth’s Niño Index.csv. https://doi.org/10.6084/m9.figshare.27638118
- NOAA Physical Sciences Laboratory. (n.d.). Ocean Niño Index (ONI). Retrieved [November 8, 2024], from https://psl.noaa.gov/data/correlation/oni.data

Leave a comment